- Research
- Open access
- Published:
GIS-based assessment of groundwater quality and suitability for drinking and irrigation purposes in the outlet and central parts of Wadi El-Assiuti, Assiut Governorate, Egypt
Bulletin of the National Research Centre volume 44, Article number: 187 (2020)
Abstract
Background
The limited water resources in arid environments in addition to the effect of agricultural and anthropogenic activities on groundwater quantity and quality necessitate paying more attention to the quality assessment of these resources. The present studies assess the quality of groundwater resources in Wadi El-Assiuti, south Egypt, and evaluate their suitability for drinking and irrigation purposes. To achieve this goal, 159 groundwater samples were collected from the outlet and central parts of the Wadi El-Assiuti during the autumn season (October–November) of 2019 and were analyzed for major ions, trace elements and heavy metals.
Results
The results indicate that the TDS values range between 1972 and 6217 ppm, while the concentration of trace elements (Fe++, Mn++ and Ni+) ranges between 0.05 and 0.46, 0.11 and 0.221 and 0.01 and 0.6 ppm, respectively. These results show that all groundwater samples are clearly unacceptable and inappropriate for human drinking due to their high content of total dissolved solids, trace elements and heavy metals, particularly in the majority of samples according to World Health Organization (WHO) guidelines and the Egyptian standards (Eg. St. 2007) for drinking water quality. Spatial analysis of the TDS values in geographic information system environment indicates that the salinity is higher in the northeast and gradually decreases southward. Sodium adsorption ratio, US Salinity Laboratory classification (1954), residual sodium carbonate, soluble sodium percentage and permeability index show that most groundwater samples are suitable for irrigation purposes.
Conclusions
The integrated approach provided in this study highlights the spatially distributed suitability of groundwater resources in Wadi El-Assiuti and can be applied in similar basins worldwide.
Background
Water is a renewable resource, but its availability is variable and limited, especially under arid conditions (Abotalib et al. 2016). At certain times of the year, almost every country in the world experiences water shortages (Gleick 1993). In fact, water resources are of importance in increasing employment in all sectors of society. Ongley (1999) stated that experts describe the global water situation as a crisis. Freshwater quality will become the principal limiting factor for sustainable development for many countries in the twenty-first century (Elawa et al. 2013). With the upstream countries in the Nile basin proceeding with building dams on the major stream of the Nile River, the Egyptian government is paying more attention to explore new resources of groundwater and to maintain the quality of groundwater for drinking and irrigation purposes (Negm et al. 2018). The groundwater aquifers in Egypt can be classified in three major groups including the Nubian Sandstone Aquifer (NAS), the fractured limestone aquifer and the Quaternary Nile aquifer (Abotalib et al. 2016; Megahed and Farrag 2019). The NAS received recharge during previous wet climatic periods and is considered as a fossil aquifer (Abotalib et al. 2019), while the Nile aquifer is currently connected with the Nile water (Megahed and Farrag 2019). In addition to these major aquifers, numerous aquifers are reported from the dense alluvium aquifers in major wadi such as Wadi El-Assiuti (Sultan et al. 2007), El-Qaa plain (Youssif et al. 2020) and El-Gallaba plain (Gaber et al. 2015).
When groundwater moves through the rocks and subsurface soil, it has the opportunity to dissolve various sources of substances and contaminants (Mahmood et al. 2017, 2018). In addition, they are distributed as an anthropogenic pollutant (Rangsivek and Jekel 2005). Trace metals in groundwater are attributed to industrial, transportation, construction activities (Hegazy et al. 2020) as well as agricultural practices (Brantley and Townsend 1999; Romic and Romic 2003), which adverse environmental effects. Fertilizers and pesticides uses for agricultural and industrial wastes have led to the ongoing accumulation of trace metals in soils (Zwolak et al. 2019; Alloway and Jackson 1991). The environmental impacts of agricultural activities and the leaching of heavy and trace metals are becoming increasingly alarming (Brindha and Kavitha 2015, Brindha et al. 2017a, b, 2020). During manufacturing processes, fertilizers are usually not sufficiently purified; they usually contain several impurities including heavy metals (Santos et al. 2002; Tanji and Valoppi 1989). Also, heavy metals are often a part of pesticide’s active compounds. The heavy metal surpluses in soils are also caused by fertilizer use. With sufficient infiltration of surface water, soil pollutants such as heavy metals can leach to the groundwater (Eugenia et al. 1996). Especially vulnerable to various contaminants are unconfined aquifers overlain by permeable soils or other aquifers (Picker et al. 1992; Pogotto et al. 2001). Recently, attention has been paid to development and rehabilitation in Upper Egypt beyond the overpopulated areas to the north of the country (El Kashouty et al. 2012).
Wadi El-Assiuti represents one of the most important hydrographic basins adjacent to the Nile Valley. Knowledge about the groundwater aquifers in the area was collected partially from different studies previously (Farrag, et al. 2002; Farrag 1997, 2007). Wadi El-Assiuti may have remnants of old drainage systems, and the main channel has a NE trend with width variations from about 1.5 km (in the central part) and about 3.5 km in the western part (Yousef 2008). Most tributaries also trend toward the NW. The N–S River Nile course south of Assiut city has been shifted eastward to take the NW trend north of Assiut city. A detailed study in Wadi El-Assiuti area was made to distinguish the lateral hydrogeological distribution of this wadi (Northern, Intermediate and Outlet areas) and to provide details about all the hydrography and the correlation within (Farrag et al. 2002). For groundwater evaluation and its suitability for different uses during the past 35 years, different studies were carried out by many authors (e.g., Abbas et al. 2018, 2019; Dawoud and Ewea 2009; Elewa 2008; Yuan et al. 2005; Abu El-Ella 1999; Bakheit et al. 1992; Bakheit 1989; Mousa et al. 1993) and others on different parts in and around Wadi El-Assiuti. All these studies showed the presence of a prolific aquifer system in the wadi's Quaternary sediments. The increase in newly reclaimed areas for different agricultural activities and the vast growth of newly established settlements (e.g., new Assiut city) in Assiut governorate have led to a search for new groundwater water resources necessary for sustainable development for agricultural expansion.
Integration of remote sensing (RS) data in a GIS environment has been widely used to explore the groundwater resources in arid environments as well as understanding the groundwater dynamics and fault controls on the groundwater flow (Paul et al. 2019; Mohamed et al. 2015; Hussien et al. 2017; Abotalib and Heggy 2019). Main GIS applications in groundwater studies include mapping and suitability analysis, assessment of groundwater flow vulnerability and their quality integrated with spatial data (Megahed and Farrag 2019; Mohammad et al. 2019; Satyajit et al. 2020; Hamed et al. 2018; Engel and Navulur 1999). GIS was also used to examine groundwater contamination and the geographical relationships between groundwater characteristics, pollution sources, land uses, topography and geology (Farrag et al. 2019; Ahn and Chon 1999). GIS-based research concluded that nitrate pollution of the groundwater occurs from dense cultivation which is considered a possible source of groundwater deterioration (Levallois et al. 1998). Groundwater pollution hazard and water quality maps were produced using GIS analyst tools in Italy (Ducci 1999). GIS and multivariate statistical analysis was adopted to investigate factors controlling groundwater quality and suitability for drinking and irrigation in the Western Nile Delta of Egypt (Armanuos and Negm 2016).
The main objective of the present study is to evaluate the groundwater quality and its suitability for drinking purposes based on Egyptian and WHO standards and to finally assess groundwater for agricultural purposes based on international recommendations for irrigation in the outlet and central parts of Wadi El-Assiuti. This is achieved using the analysis of the major ions, trace elements and heavy metal concentrations in the collected groundwater samples.
Description of the study area
Location and climate
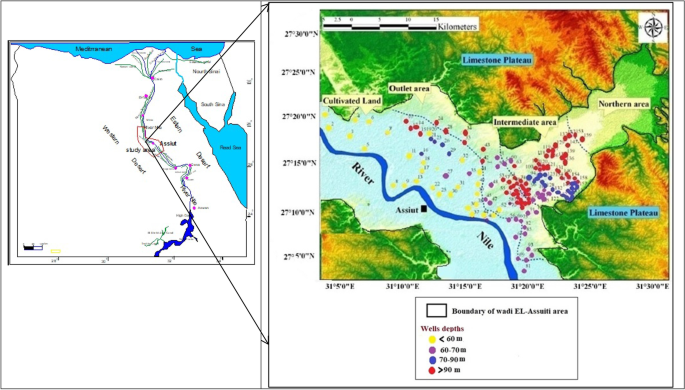
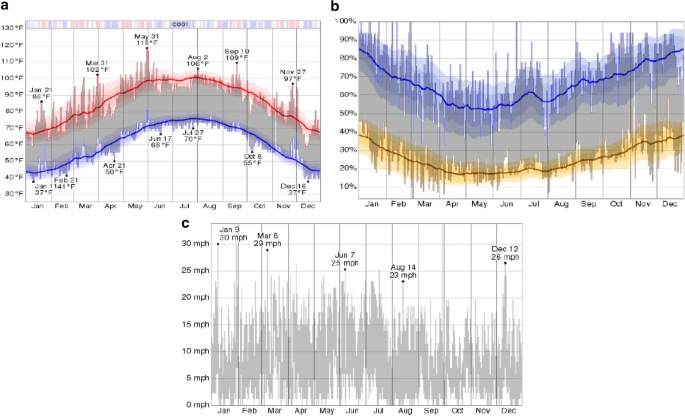
Wadi El-Assiuti constitutes a part of the Eastern Desert and is one of the most significant wadis in middle Egypt which is a natural extension of Assiut Governorate. It represents one of the most promising desert areas for sustainable development where groundwater can be extracted. It is a dry drainage basin, whose main channel is 186 km in length (Elewa 2008). The study area includes the outlet and central parts of Wadi El-Assiuti which lie to the east of the River Nile northeast of Assiut. It is located between the latitudes 27° 00′ and 27° 30′ N and the longitudes 31° 00′ and 31° 30′ E (Fig. 1) and covers an area of about 2500 km2. According to the Egyptian Meteorological Authority (EMA 2019), Wadi El-Assiuti area is characterized by arid to semiarid climate. The annual average temperature in the area is about 29 °C (minimum temperature 18 °C and maximum temperature about 40 °C which rises throughout the year) due to the governorate's site in the hot desert zone. From the rainfall data, it can be observed that the average yearly precipitation in Wadi El-Assiuti is lower than that happened in mountainous region toward the east. In general, the amount of rainfall in the study area is not significant throughout the year. The average rainfall value is approximately 0.7 mm/month, and the relative humidity is 38%, while the average evaporation in about 14.2 mm/year and the average wind reach around 7.5 Knot/hour (Fig. 2).
Representation of the recorded a temperature, b humidity and c wind speed values during the year 2019 in the study area (EMA 2019)
Geological and hydrological setting
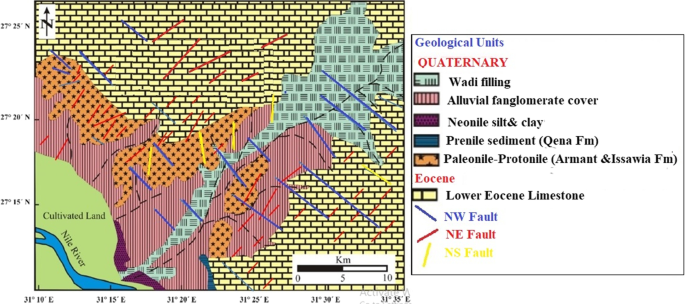
The study area is completely covered by sedimentary rocks from different ages ranging from lower Eocene to Holocene times (Fig. 3). In the present study, the stratigraphy of Wadi El-Assiuti and the surrounding parts is reviewed from previous studies, especially those of Said (1981, 1990; Mansour and Philobbos 1983; Klitzsch et al. 1987 and others). The wadi filling deposits are composed of gravel of different sizes with washed macrofossils and nummulites in a sandy, limey and clayey matrix; all derived from the adjacent limestone plateau during recent times and were classified from the oldest to the most recent by Said (1981) being Protonile, Penile and NeoNile sediments (Al-Ruwash and Shehata 2003), (Fig. 3). The lower Eocene sequence borders the study area at its eastern side and is composed of carbonate rocks (limestone and dolomites). It has been studied by many authors (e.g., Bishay 1961; El-Naggar 1970; Omara et al. 1970; Youssef et al. 1982; Keheila 1983; Mansour and Philobbos 1983). The main characteristic structural features of the different geological formations have been documented by the following (Said 1961, 1962; Omara and El-Tahlawi 1972; Omara et al. 1970, 1973; Osman 1980; Bakhiet 1989; Mansour and Philobbos 1983; Shama 1972 and others). The fault trends were arranged according to their decreasing order as N–S, NW and NE trends. Anticlines and synclines are well observed. The synclines form narrow structures ranging between 100 and 200 m in amplitude and between 100 and 500 m in width. The generally symmetrical dips of the flanks reach a maximum of 60° and usually range between 30° and 45°. The anticlines form broad swells having little effect on the prevailing physiography of the Eocene plateau. The exposed limestone region around Wadi El-Assiuti is highly dissected by both major and minor joints. Some fissures and joints in different parts are sites of mineralization (Omara et al. 1973). Joints observed in the different parts of the area are mainly perpendicular to the bedding planes and show very high dip angles.
Geological map of the study area, modified by Said (1981)
Population and economic increase causes the increase in drilling activities for groundwater extraction in the dryland environments and causes more problems concerning the groundwater potentiality. This urgently requires implementing a policy or management scheme for this critical area east of Assiut to diminish the problems (El Bastawesy et al. 2012). Hydrogeologically, the investigated water-bearing formations in Wadi El-Assiuti are classified as follows: Quaternary aquifer dominating the outlet area and the upper zone in the central part with depths ranging from 25 to 50 m. Conversely, the Plio-Pleistocene aquifer dominates the central parts of the wadi and is generally distinguished by two zones: The first has an aquifer depth ranging from 40 to 70 m; however, the second is presents greater depths reaching 180 m. The Pleistocene groundwater aquifer in the area is the most exploited one for agricultural purposes. The Eocene aquifer is lying in the southeastern border of the wadi, and its aquifer depth is more than 90 m.
Methods
To obtain the physiochemical characteristics of the groundwater in the area, some field and laboratory measurements and analysis were carried out. These included the assessment of the water's physical and chemical parameters such as total dissolved solids (TDS), concentrations of hydrogen ions (pH), electrical conductivity (EC), and concentrations of a few major and trace ions. Groundwater samples collection procedure considers the representation of all aquifers and the variability of depth in the study area. One hundred and fifty-nine groundwater samples were collected from wells located in the studied area during the autumn season (October to November) of 2019 (Fig. 1). Well locations were detected by using a Global Positioning System (GPS). The water analysis was carried out in the Geology Department, Faculty of Sciences at Assiut University, and Environmental Agency Affair according to the methods adopted by Rainwater and Thatcher (1960) and the methods described Fishman and Friedman (1985). A portable field kit was used for measurements of pH and EC in field. Cl−, HCO3−, Ca++, and Mg++ contents were measured by titration, while SO4− concentration was estimated by turbidity, and Na+ and K+ contents were estimated by flame photometer. The samples were then transported to the laboratory and stored in a refrigerator at approximately ~ 20 °C to prevent change in volume due to evaporation. The inductive couples plasma (ICP) determined trace metals (Pb, Ni, Mn, and Fe). The collection of the geological and hydrogeological data of Assiut Governorate was done from previous works and reports to prepare a base map of the studied area and to collate all the graphical representation and maps for the analytical results. A geo-spatial database was built using Arc GIS 10.1 software, (ESRI 2006) and Groundwater software for Windows (GWW) computer software to present and observe the of changes of main and trace ions distribution of groundwater samples in the study area to assess of groundwater quality and their suitability for drinking, irrigation and other uses then the visualization of results and expectation of the best locations in the studied area which contain suitable groundwater for drinking and agriculture to provide time and cost when drilling underground water wells.
Result
Laboratory analyses
The physical properties
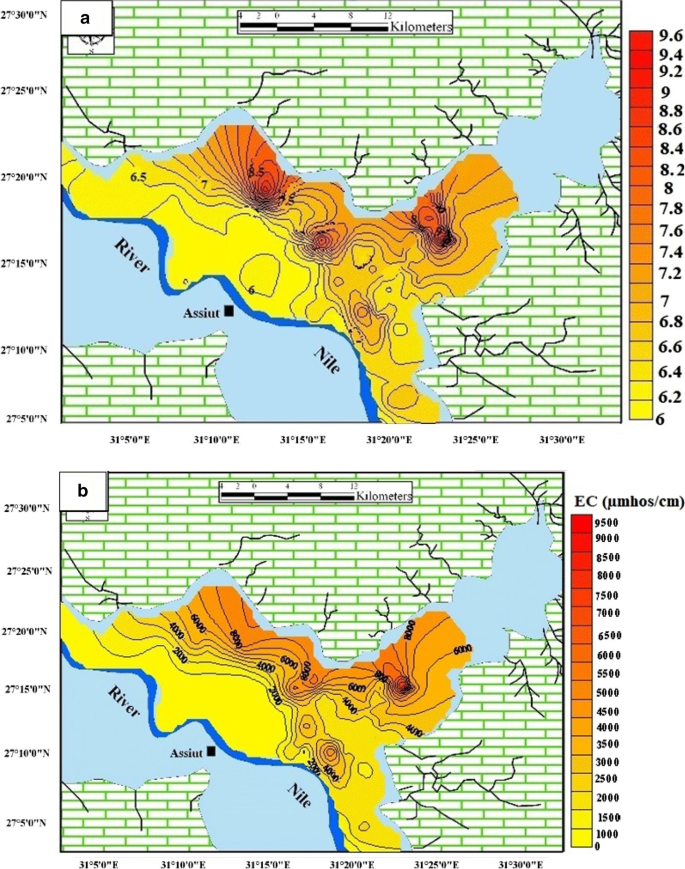
Water temperature affects ionic strength, conductivity, dissolution, solubility and corrosion. In the study area, groundwater temperature ranged between 22 and 28 °C which may be due to structures or differences in drilling depths. With most types of groundwater in direct contact with the atmosphere, pH value ranged from 6.5 to 9.5 which reflects that the groundwater samples are neutral to strongly alkaline and EC values ranged between 1143 µmhos/cm (Well No. 11) and 9280 µmhos/cm (Well No. 42). pH and EC values of the collected groundwater samples in the studied area are shown in Table 1 and Fig. 4a, b.
Chemical properties and groundwater composition
Ions concentrations and distribution
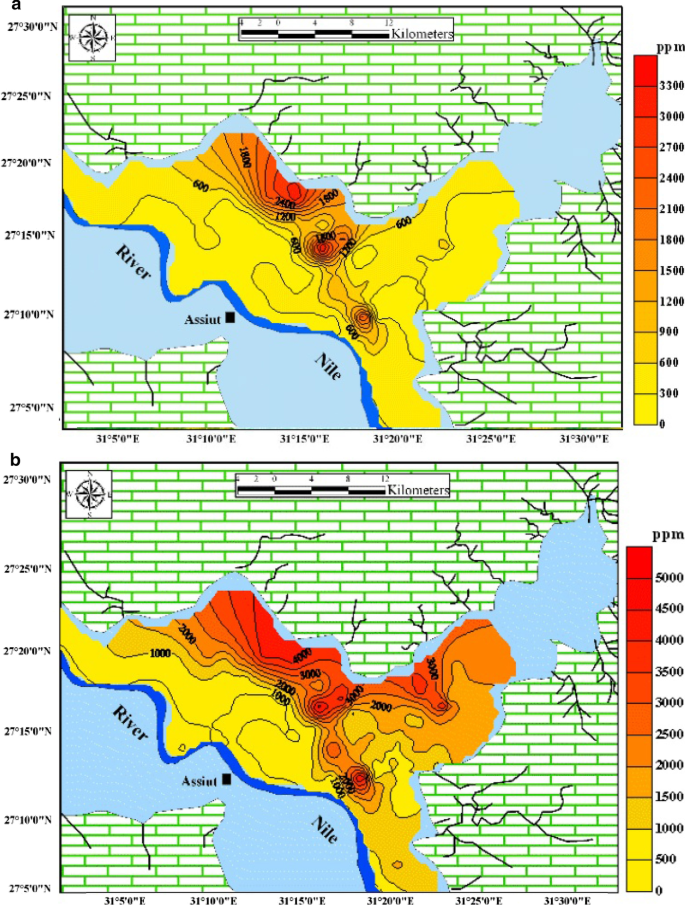
The chemical characteristics of groundwater are mainly influenced by the surface and subsurface geochemical evolution during water movement. These processes control the water quality by increasing the dissolved ion contents by increasing water–rock interaction. The intensity of these exchanges depends on the physical and chemical properties of the surrounding rocks and water temperature. The chemical composition of the studied groundwater samples was obtained as shown in Table 2. Noticeably, the total concentration of Ca++, Mg++, Na+, K+, HCO3−, SO4– and Cl− often exceeds 90% of the total dissolved solid (TDS) in water, regardless of whether the water is diluted or the salinity is higher than seawater (Freeze and Cherry 1979). TDS values of groundwater in the study area varied from 1972 ppm (Well No. 11) to 6217 ppm (Well No. 42). According to classifications by Davis and Dewiest (1966) or by Hem (1970), 34.45% of the groundwater samples in the study area are freshwater and 65.54% are moderately saline (brackish water). The TDS distribution map of the studied area (Fig. 5a) shows general increases toward the north and the northeast directions close to the limestone plateau depending on the type, composition, and thickness of the water-bearing sediments and the distance to the recharging by Nile River and decreases toward the southern part. The increase in salinity toward the northeastern direction may relate to the general trend of groundwater flow in the same direction. This could be related to the change in lithology and structural pattern in water-bearing formations due to the slow groundwater movement and the long distance from the southern to the northern parts and may also be due to the prolonged duration underground. It is observed that wells No. 11 and 135 are of high TDS content which is mainly due to the presence of contamination sources. The type of water varies between “slightly hard” and “excessively hard” as shown in the iso-hardness contour map (Fig. 5b), indicating that hardness increased toward the north and it had a local variation in the southern part of the study area. Inspection of the spatial distribution of well depth (Fig. 1) compared to the measured TDS shows that with increasing depths. The TDS values generally decrease. This could be attributed to the agriculture activates, high hydraulic characteristics of the surfaced aquifer and arid climatic conditions. In the studied area, the total hardness (TH) ranges from “slightly hard” to “excessively hard. According to the TH classification, 59.66% of the groundwater samples are considered very hard water, 20.17% are excessively hard water, 15.97% are moderately hard water, and 5.04% are slightly hard water (Tables 3 and 4).
Major and trace ions distribution
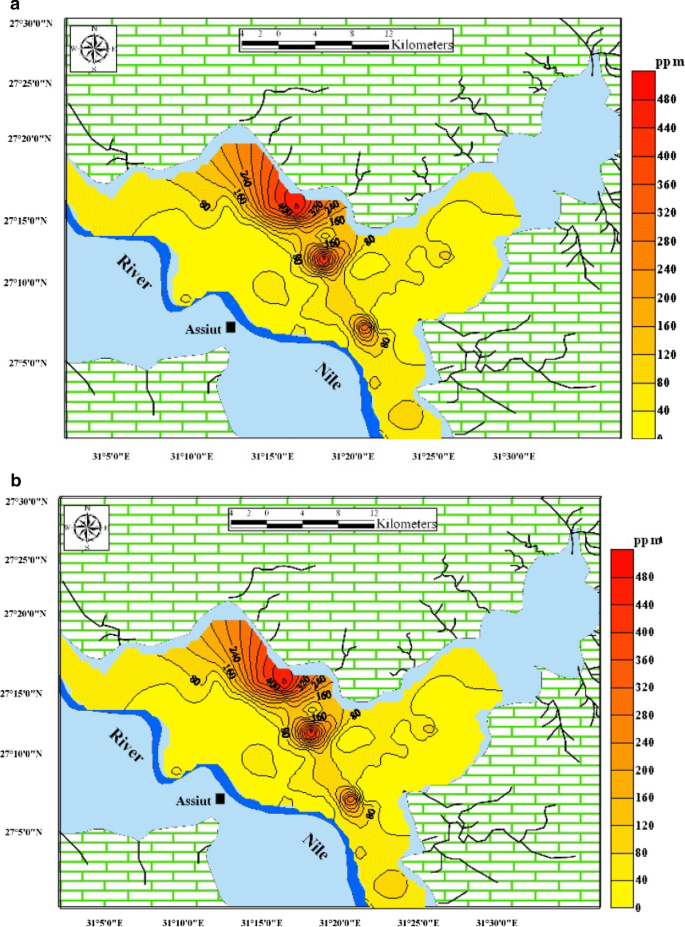
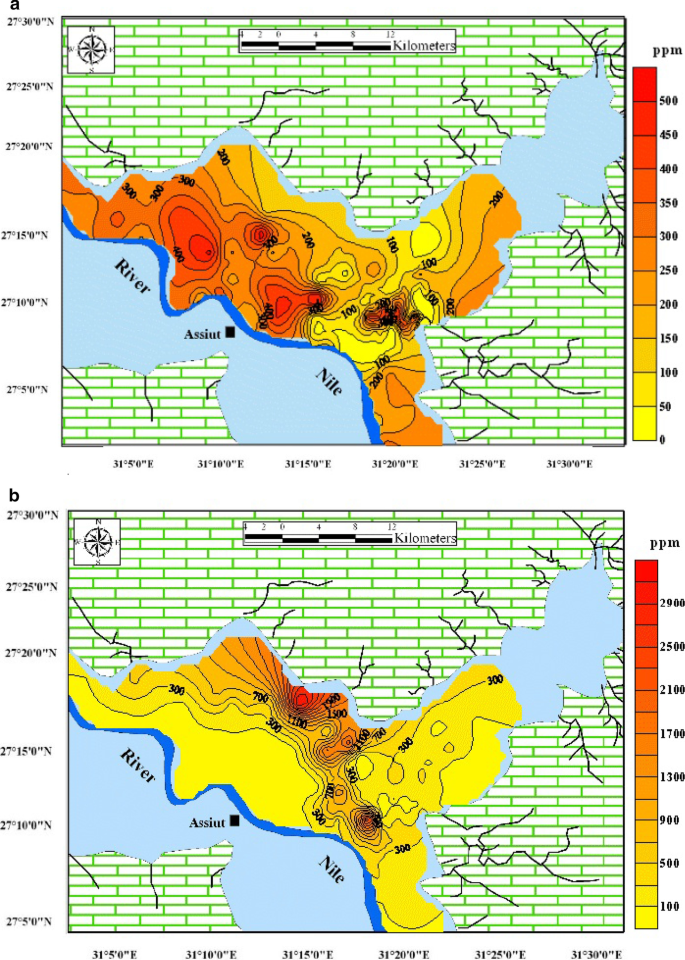
Calcium ion concentration ranges in the studied area were from 15.23 ppm (Well No. 23) to 611.2 ppm (Well No. 42) while magnesium concentrations in groundwater ranged from 4.20 ppm (Well No. 71) to 532.26 ppm (Well No. 42). Generally, calcium and magnesium concentrations increase in the north and northeast directions toward the limestone plateau (Fig. 6a, b). Sodium ion content varied from 49.30 ppm (Well No. 1) to 1950 ppm (Well No. 135), and potassium concentrations ranged between 0.39 ppm (Well No. 11) and 320.80 ppm (Well No. 61). The total concentrations of sodium and potassium in the studied area varied from one place to another ranging between 63.59 ppm (Well No. 11) and 1957 ppm (Well No. 135). The concentration of sodium and potassium ions showed a general increase in the northeastern part of the studied area, consistent with the distribution of TDS (Fig. 6c, d). The distribution of bicarbonate in the study area shows some anomalies especially in the central and northwestern parts (Fig. 7a). This is mainly due to leaching with either the remaining limestone or the limestone plateau. In general, the sulfate ions concentrations in most wells are not high ranging between 11.50 ppm (Well No. 129) and 3319 ppm (Well No. 34) (Fig. 7b). It is noticed that there is a general increasing trend northeast, in addition to positive anomalies in the central part. These high concentrations may be due to the presence of gypsum deposits at these localities. Finally, the distribution of chloride ions shows a general increase in the northeastern direction and decreases toward the southwestern direction and ranges between 40 ppm (Well No. 11) and 3200 ppm (Well No. 135) (Fig. 7c). The high chloride concentration is possibly related to leaching of the soluble chloride minerals in deep sedimentary basins, especially shale sequences with the upwelling of deep groundwater from the Nubian Aquifer along vertical sub vertical faults (Sultan et al. 2007; Abotalib et al. 2016). This direction is compatible with the regional groundwater flow pattern in the studied area. Many elements are present in groundwater in low concentrations (less than 0.1 ppm) and sometimes much higher. Some trace elements such as Fe++, Mn++, Ni+ and Pb+ were measured at some water points in the study area (Table 5). The iron concentration measured in some groundwater samples ranged between 0.05 and 0.46 ppm while manganese concentrations ranged between 0.11 and 0.221 ppm. Lead concentration was not detected in many samples; however, it appeared at 0.05 ppm in some samples which is within the permissible limits (0.01 mg/L). Nickel ions in the study samples were rare although in some samples it was detected with very low concentration ranges between 0.01 and 0.6 ppm.
Hypothetical salt combinations
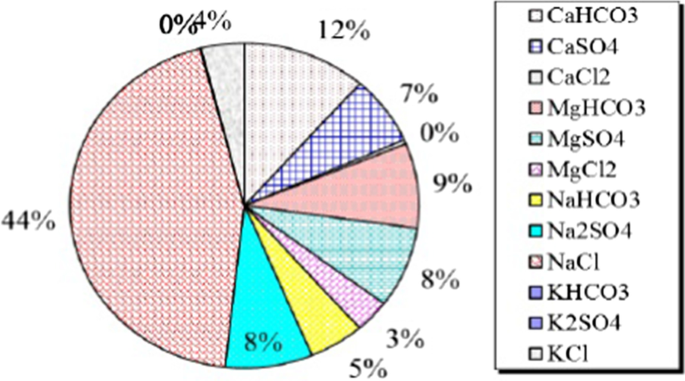
The hypothetical salts assemblages are the most widely used and easiest method for displaying the chemical analysis of water samples using PHREEQCA computer program (Parkhurst and Appelo 1999). Hypothetically, strong acid ions (Cl− and SO4–) are generally combined with alkalis (Na+ and K+) and alkaline earth (Ca++ and Mg++) are combined with the remainder of the radicals. If the latter is in surplus in the water, then they will combine with weak acids (CO3–, HCO3−). The calculated hypothetical salt combinations for the studied area are tabulated in Table 6 and revealed the presence of different groups of salt assemblages. The hypothetical salt combinations in the studied area indicated the presence of a variety of salts as follows: NaCl, Ca(HCO3)2, Mg (HCO3)2, Na2SO4, MgSO4, CaSO4, NaHCO3, KCL and MgCl2. Figure 8 shows the relationships between cations and anions in bar graph form. Their average equivalent percentages are 44.108%, 11.526%, 8.43%, 8.108%, 8.044%, 6.873%, 5.118%, 3.978% and 3.270%, respectively.
Hydrochemical facies and groundwater genesis
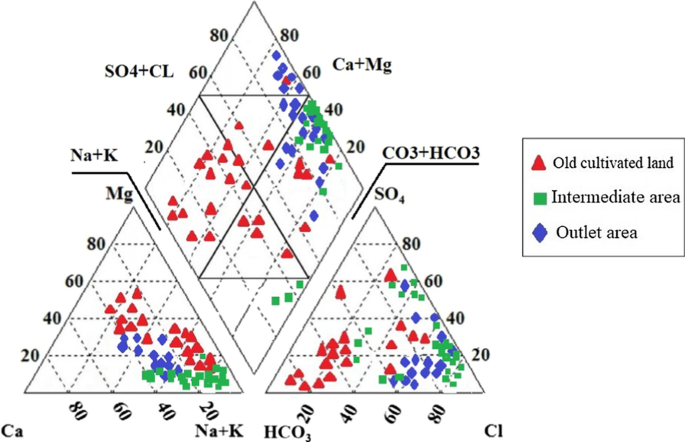
The hydrogeochemical facies and groundwater genesis can be understood by plotting the geochemical data on Piper (1944) trilinear diagrams. The Piper trilinear diagram includes three distinct plotting fields, two lower left, lower right triangular fields and a diamond-shaped field intersecting the two triangles at the upper part. Generally, the groundwater samples appear in the upper diamond field and have secondary salinity properties, where sulfate and chloride exceed sodium and potassium. On the other side, those that appear in the lower triangle are considered as having alkaline properties, where carbonates and bicarbonates exceed calcium and magnesium. The results of the analyzed samples were plotted on Piper diagrams (Fig. 9). This diagram illustrates that most of the groundwater samples are located close to each other which indicates that they are of similar origins. In the outlet and intermediate areas, it is clear that sodium and potassium ions represent the main dominating cations, while chloride ions are the main dominating anions. This reflects that most of the samples have sodium chloride facies. In the majority of the groundwater samples collected from the old cultivated land areas, sodium ions represent the most dominant cations. Alternatively, bicarbonate ions are the dominating anions in most samples with magnesium and calcium bicarbonate representing the main facies.
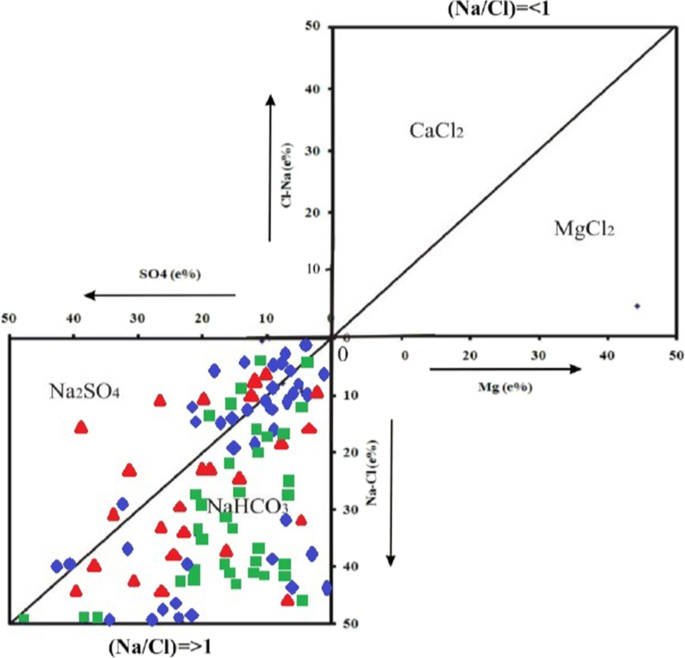
According to the calculated percentages of the hydrochemical composition, Sulin’s (1948) diagram was used to reveal the groundwater genesis and the type of water. This genetic diagram consists of two equal quadrants. The water samples which are plotted in the upper right square indicate the marine origin of MgCl2 and CaCl2 water type, while the water samples projected in the lower left square indicate the meteoric origin of Na2SO4 and NaHCO3 water types. Plotting groundwater samples on the Sulin diagram (Fig. 10) indicates that most of the samples are of meteoric origin (Na2SO4 and NaHCO3), while other samples could be of a mixed origin with deeper groundwater sources such as the Nubian water (Himida 1970).
Discussion
Groundwater suitability for drinking
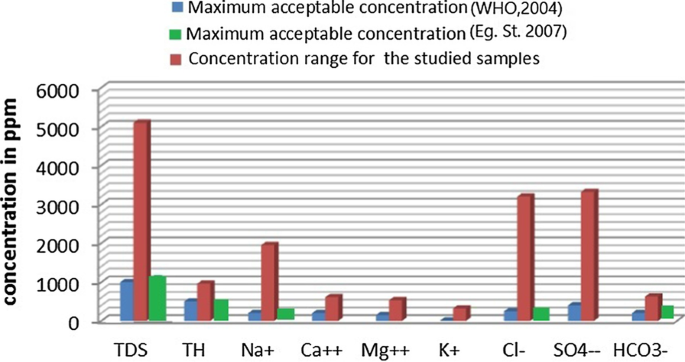
Groundwater quality parameters (pH, TDS, EC, TH, Ca++, Mg++, SO4–, Cl−, Na+ and K+) were used to assess the suitability for drinking purposes according to WHO (2004) and Eg. St. (2007) limits, (Table 7). Water quality in the study area varied greatly regarding the appropriateness for drinking and domestic purposes. According to salinity TDS, all groundwater samples are unsuitable due to their high content of total dissolved solids (Fig. 11). Also, according to minor and trace constituents, 90% of groundwater samples are unsuitable for human drinking because of the higher content of measured trace elements in the majority of samples. About 80% of the groundwater proved to be unsuitable for domestic and laundry usage because the ranges were from hard to very hard and 6% to the extent of moderate.
Groundwater suitability for irrigation
Groundwater suitability for agriculture depends on various factors such as effective salinity hazard, sodium adsorption ratio (SAR), soluble sodium percentage (SSP), residual sodium carbonate (RSC) and permeability index (PI). Mineral constituents of groundwater affect soil structure and permeability, which in turn indirectly affects crop growth.
Sodium adsorption ratio (SAR)
The main problem of high concentration of sodium is its impact on the permeability of the soil, water infiltration and total salinity increase in its therefore harmful to sensitive crops. Sodium concentration is estimated by the sodium absorption ratio which is calculated by the following formula (Richards 1954), (Eq. 1):
The irrigation water is classified according to SAR into four main classes as indicated in Table 8. Continued use of water with high SAR results in a deterioration of the soil's structure. Sodium replaces calcium and magnesium that is absorbed by clay minerals and allows the soil particles to disperse. This dispersion leads to a deterioration of soil aggregates and induces soil cementation under drying conditions, as well as preventing rainwater infiltration. For the studied area, the calculated SAR values of the collected groundwater samples and their corresponding classes are given in Table 9. SAR values range between 1.03 and 30.57 in the studied groundwater samples. Thus, 78.15% of the groundwater samples are considered excellent and can be used for all soil types with no harmful effects from sodium, 12.6% of the groundwater samples are good, 7.56 of the groundwater samples are fair, and 1.68% of the groundwater samples are of poor quality for irrigation purposes.
Salinity hazard
In general, salinity problems are more severe during the early stages of growth and vegetable crops are more sensitive to salinity than field crops. Good drainage systems coupled with good irrigation management strategies are the most effective tools to control salinity in most soils. The irrigation water can be classified into four main categories based on the EC and the sodium adsorption ratio (SAR) (Tables 10, 11).
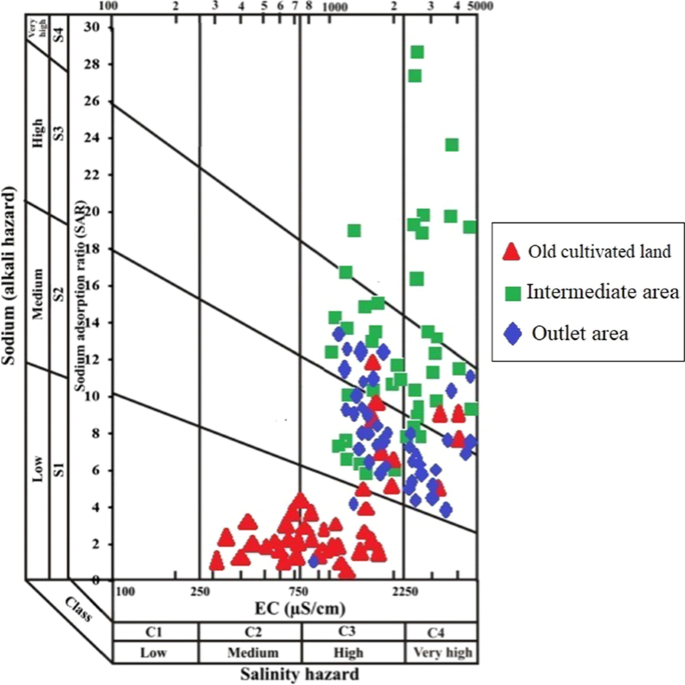
The values of the salinity hazard (EC) and the sodium adsorption ratio (SAR) of the available groundwater samples are plotted on the Wilcox diagram with the aid of the United Nations and GWW software program 1994 (Fig. 12). The representation of groundwater samples parameters on the Wilcox diagram indicates that almost all of the samples are located in C3-S1 and C3-S2 classes (low sodium hazard and high salinity hazard), except for a few samples which are in C4S4 class (very high sodium hazard and very high salinity hazard) and some fewer samples in C4S3 class (very high sodium hazard and high salinity hazard). This indicates that the water can be used in all types of soil except the last samples which can be used for soils with restricted drainage. From the above discussion, the suitability of the studied groundwater samples for irrigation purposes indicates that most of the groundwater samples can be used for all soils and most crop types.
Bicarbonate and carbonate's negative effects can be indicated by the high concentrations of Ca++ and Mg++. The RSC equation (Eq. 2) (Eaton 1950) is used to indicate the potential for Ca++ and Mg++ precipitation at the soil surface and the removal of Ca++ and Mg++ from the soil solution. As RSC increases, calcium and some magnesium are precipitated from the solution, raising sodium percentages and the sodium adsorption rate on soil particles, which in turn raises the potential for sodium hazard. The RSC is calculated by the following formula:
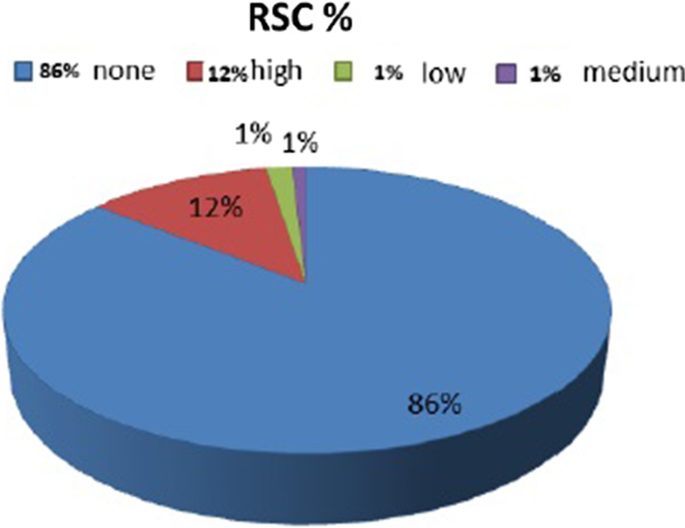
Residual sodium carbonate (RSC) values for the available groundwater samples are tabulated in Table 12 and Fig. 13. It is clear that most of the groundwater samples are considered safe for irrigation according to their RSC contents (86%) and are not hazardous, whilst some other samples have high (12%), medium (1%) and low (1%) values of RSC. Therefore, most of the available groundwater samples in the area are suitable for irrigation according to their calculated RSC values.
Soluble sodium percentage (SSP)
Soluble Sodium Percentage (SSP) is an estimation of the sodium hazard of irrigation water such as SAR, but represents the percentage of sodium out of the total cations as with SAR. The correlations of sodium only with Ca2+ and Mg2+ and is determined by the following equation (Eq. 3):
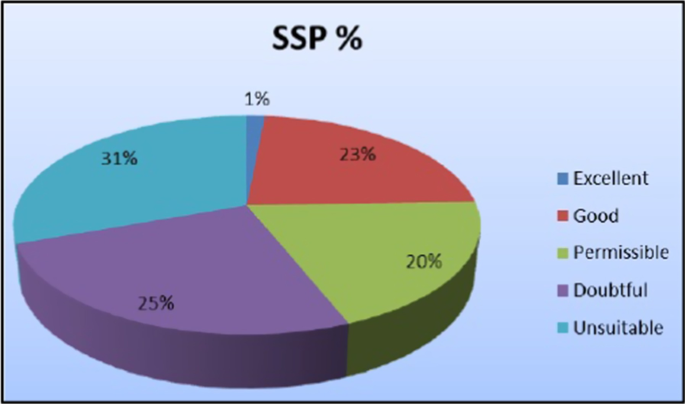
According to the results in Table 13 and Fig. 14, it deduced that 1% of the samples are excellent, 23% are good, 20% are permissible, 25.2% are doubtful, and 31% are unsuitable for irrigation.
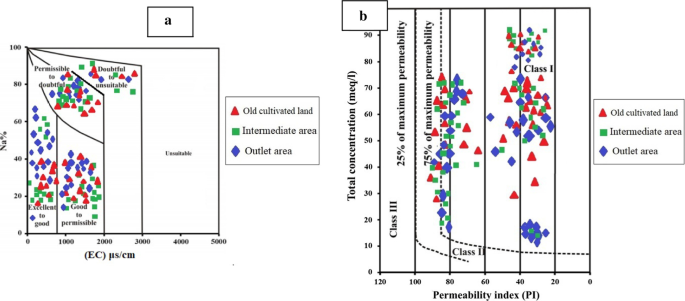
Wilcox (1955) designed a graph to represent the relation between sodium percent (Na %) and specific conductance (EC) to defined the propriety of groundwater samples for irrigation. He divided the graph into five zones which represent the changes in irrigation water classes.
According to sodium percent classification in Table 14 and Wilcox diagram in Fig. 15a, we showed that most samples were good and forty samples are doubtful due to the high sodium concentration. Also, few samples were permissible and twenty-one samples were excellent for irrigation.
Permeability index (PI)
Sodium is significant chemical components in irrigation water that can cause reduce of soil permeability. To calculate the PI were used calcium, magnesium, sodium and bicarbonate ions which are given by Eq. 4 (Doneen 1964). According to PI classification, all samples were plotted in group I&II and suitable for irrigation (Fig. 15b).
Conclusions
It is necessary to assess and map the available groundwater resources for different purposes in some remote areas to support urbanization and land reclamation projects. Groundwater quality and suitability for drinking and agricultural purposes were assessed using the spatial and hydrochemical analysis of the available wells. GIS of groundwater quality and suitability for various purposes provides essential input for the management and planning of the research area and similar regions. The results showed that large values of TDS observed in the middle part of the study area are possibly related to the increase in the agricultural activities and pumping rates in these areas so an urgent need to implement strategies to reduce these problems in this area is required. In accordance with international irrigation guidelines, most characteristics of the wells are appropriate and acceptable for irrigation purposes. The present conditions indicate that groundwater in the study area will worsen unless urgent measures are taken to protect the Quaternary groundwater aquifers and mitigation of contamination risk. Therefore, the study recommends that well depth in the area should not be less than 120 m to avoid the percolation of polluted water, controlling the application of agrochemicals on agricultural lands and managing the use of hazardous fertilizers and pesticides. In addition, the removal of iron is recommended using the physical treatment method as levels in the majority of the studied wells exceeds 0.3 ppm.
Availability of data and materials
All data generated or analyzed during this study are included in this manuscript.
Abbreviations
- GIS:
-
Geographic Information System
- RS:
-
Remote Sensing
- WHO:
-
World Health Organization
- Eg. St:
-
Egyptian Standard
- SAR:
-
Adsorption Ratio
- RSC:
-
Residual Sodium Carbonate
- SSP:
-
Soluble Sodium Percentage
- GWW:
-
Groundwater software for Windows
- TDS:
-
Total Dissolved Solids
- pH:
-
Concentrations of Hydrogen Ions
- EC:
-
Electrical Conductivity
- GPS:
-
Global Positioning System
- PI:
-
Permeability Index
References
Abbas A, Majid R, Amir HM, Ramin N, Mahmood Y, Hamed S, Mahmood A (2018) Groundwater quality assessment for irrigation purposes based on irrigation water quality index and it’s zoning with GIS in the villages of Chabahar, Sistan and Baluchistan, Iran. Data Brief 19:623–631. https://doi.org/10.1016/j.dib.2018.05.061
Abbas A, Nader Y, Amir HM, Ramin N, Majid R, Mahmood Y, Mahmood A (2019) Evaluation of groundwater quality using water quality index and its suitability for assessing water for drinking and irrigation purposes: case study of Sistan and Baluchistan province (Iran). Hum Ecol Risk Assess Int J 25(4):988–1005. https://doi.org/10.1080/10807039.2018.1458596
Abotalib AZ, Heggy E (2019) Groundwater mounding in fractured fossil aquifers in the Saharan–Arabian desert. In: Conference of the Arabian Journal of Geosciences. Springer, Cham, pp 359–362
Abotalib AZ, Sultan M, Elkadir R (2016) Groundwater processes in Saharan Africa: implications for landscape evolution in arid environments. Earth Sci Rev 156:108–136
Abotalib AZ, Sultan M, Jimenez G, Crossey L, Karlstrom K, Forman S, Krishnamurthy RV, Elkadiri R, Polyak V (2019) Complexity of Saharan paleoclimate reconstruction and implications for modern human migration. Earth Planet Sci Lett 508:74–84
Abu El-Ella EM (1999) Hydrogeochemical evolution of groundwater aquifers the area East of Assiut Nile Basin. Assuit Univ J Geol 28(1):299–314
Ahn H, Chon H (1999) Assessment of groundwater contamination using geographic information systems. Environ Geochem Health 21:273–289
Alloway B, Jackson A (1991) The behaviors of heavy metals in sewage amended soils. Sci Total Environ 100:151–176. https://doi.org/10.1016/0048-9697(91)90377-q
Al-Ruwash FM, Shehata M (2003) Groundwater quality of the Nile west bank related to soil characteristics and geological setting between Mallawy and baliana area. J Arid Environ 49:761–784. https://doi.org/10.1006/jare.2001.0793
Armanuos AM, Negm AM (2016) GIS-based spatial distribution of groundwater quality in the Western Nile Delta, Egypt. In: Negm A (ed) The Nile Delta. The handbook of environmental chemistry, vol 55. Springer, Cham, pp 89–119. https://doi.org/10.1007/698_2016_66
Bakheit AA (1989) Geological and geophysical studies on the areas around Wadi El-Assiuti, Eastern Desert, Egypt. PhD thesis, Department of Geology, Assiut University
Bakheit AA, Ibrahim HA, Omran AA, Senosy MA (1992) Groundwater exploration by resistivity method at the entrance of Wadi El-Assiuti, Eastern Desert, Egypt. Bull Fac Sci Assiut Univ 21(2):65–78
Bishay Y (1961) Biostratigraphic study of the Eocene in the Eastern Desert between Samalut and Assuit by the large foraminifera. 3rd Arab. Pet. Congr., Alexandria
Brantley S, Townsend G (1999) Leaching of pollutants from reclaimed asphalt pavement. Environ Eng Sci 16:151–176. https://doi.org/10.1089/ees.1999.16.105
Brindha K, Kavitha R (2015) Hydrochemical assessment of surface water and groundwater quality along Uyyakondan channel, south India. Environ Earth Sci 73:5383–5393. https://doi.org/10.1007/s12665-014-3793-5
Brindha K, Paul P, Touleelor S, Somphasith D, Elango L (2017a) Geochemical characteristics and groundwater quality in the Vientiane Plain, Laos. Expo Health 9:89–104. https://doi.org/10.1007/s12403-016-0224-8
Brindha K, Paul R, Walter J et al (2017b) Trace metals contamination in groundwater and implications on human health: comprehensive assessment using hydrogeochemical and geostatistical methods. Environ Geochem Health. https://doi.org/10.1007/s10653-020-00637-9
Brindha K, Paul R, Walter J et al (2020) Trace metals contamination in groundwater and implications on human health: comprehensive assessment using hydrogeochemical and geostatistical methods. Environ Geochem Health. https://doi.org/10.1007/s10653-020-00637-9
College of Agricultural Sciences (2002) Irrigation water quality. The Pennsylvania State University, State College
Davis SN, Deweist RJM (1966) Hydrogeology. Wiley, New York. https://doi.org/10.1016/0022-1694(68)90062-0
Dawoud MA, Ewea HAR (2009) Sustainable development via optimal integration of surface and groundwater in arid environment: Nile River Quaternary Aquifer Case Study. In: The international conference on water conversation in arid regions, Jeddah, 12–14 Oct 2009
Doneen LD (1964) Water quality for agriculture. University of California, Davis
Ducci D (1999) GIS techniques for mapping groundwater contamination risk. Nat Hazards 20(2–3):279–294. https://doi.org/10.1023/A:1008192919933
Eaton EM (1950) Significance of carbonates in irrigation waters. Soil Sci 69:123–133
Egyptian Higher Committee for Water (EHCW) (2007) Egyptian standards for drinking and domestic uses. EHCW, Cairo
El Bastawesy M, Ali RR, Deocampo DM, Al Baroudi MS (2012) Detection and assessment of the waterlogging in the dryland drainage basins using remote sensing and GIS techniques. IEEE J Sel Top Appl Earth Obs Remote Sens 5(5):1564–1571
El Kashouty MA, El-Sayed EE, Elewa AM, Morsi MS (2012) Environmental impact of anthropogenic activities on surface and groundwater systems in the western part of the River Nile, between El-Edwa–Der Mawas area, El Minia Governorate, Upper Egypt. J Am Sci 8(5):150–161
Elawa AMT,El Kashoute MA, El-Sayed EE, Morsi MS (2013) Quantitative study of surface and groundwater systems in the western part of the River Nile, Minia Governorate, Upper Egypt: water quality in relation to anthropogenic activities, Greener Journal of Physical Sciences. ISSN: 2276-7851
Elewa HH (2008) Prediction of future drawdown of water levels of the Pleistocene aquifer system of Wadi El-Assiuti Area, Eastern Desert, Egypt, as a criterion for management and conservation. Resour Conserv Recycl 52:1006–1014. https://doi.org/10.1016/j.resconrec.2008.03.006
El-Naggar ZR (1970) The genus Rugoglobigerina in the Maastrichtain Sharawana shale of Egypt. In: Proceeding II planktonic conference, Roma, vol 1, pp 477–537
EMA (2019) Climatic Atlas of Egypt. Egyptian Meteorological Authority, Ministry of Transport and Communications, Cairo
Engel BA, Navulur KCS (1999) The role of geographical information systems in groundwater engineering. In: Delleur JW (ed) The handbook of groundwater engineering, chap 21. CRC Press LLC, Boca Raton, pp 1–16
ESRI (2006) ArcGIS 9.1, GIS and mapping software
Eugenia G, Vicente S, Rafael B (1996) Heavy metals incidence in the application of inorganic fertilizers and pesticides to rice farming soils. Enviorn Pollut 92:19–25. https://doi.org/10.1016/0269-7491(95)00090-9
Farrag AA (1997) Complementary groundwater and soil studies on Wadi El-Assiuti by the help of Satellite Images and GIS technique. Bull Fac Sci Assiut Univ 26(3-F):45–64
Farrag AA (2007) On the groundwater assessment and management in Wadi El Assiuti, Eastern Desert, Egypt. In: The fifth international conference on the geology of Africa, Assiut University, vol 1, pp 11–48
Farrag AA, Riad S, Ahmed MH (2002) Groundwater situation and evaluation in the Nile Basin East of Assiut, Egypt. J Eng Sci Assiut Univ 30(2):517–542
Farrag AEA, Megahed HA, Darwish MH (2019) Remote sensing, GIS and chemical analysis for assessment of environmental impacts on rising of groundwater around Kima Company, Aswan, Egypt. Bull Natl Res Centre 43:14. https://doi.org/10.1186/s42269-019-0056-3
Fishman MG, Friedman LC (1985) Methods for determination of inorganic substances in water and fluvial sediments. U. S. Geol. Surv., Book 5, Chapter. A1. Open File Report, Denver, Colorado, USA, pp 85–495. https://doi.org/10.3133/twri05A1
Freeze RA, Cherry JA (1979) Groundwater. Prentice-Hall, Englewood Cliffs
Gaber A, Soliman F, Koch M, El-Baz F (2015) Using full-polarimetric SAR data to characterize the surface sediments in desert areas: a case study in El-Gallaba Plain, Egypt. Remote Sens Environ 162:11–28
Gleick PH (1993) Water and Conflict: fresh water resources and international security. Int Secur 18(1):79–112. https://doi.org/10.2307/2539033
Hamed S, Abbas A, Mahmood Y, Ali AM, Fazlollah CK (2018) Data on assessment of groundwater quality for drinking and irrigation in rural area Sarpol-e Zahab city, Kermanshah Province, Iran. Data Brief 17:148–156. https://doi.org/10.1016/j.dib.2017.12.061
Hegazy D, Abotalib Z, El-Bastaweesy M, Al-Said M, Melegy A, Garamoon H (2020) Geo-environmental impacts of hydrogeological setting and anthropogenic activities on water quality in the Quaternary aquifer southeast of the Nile Delta, Egypt. Afr Earth Sci. https://doi.org/10.1016/j.jafrearsci.2020.103947
Hem JD (1970) Study and interpretation of the chemical characteristics of natural water, northeast of Assiut. PhD thesis, Assiut University, Assiut
Himida IH (1970) The Nubian artesian basin, its regional hydrogeological aspects and palaeohydrological reconstruction. J Hydrol Neozeland 9(2):89–116
Hussien HM, Kehew AE, Aggour T, Korany E, Abotalib AZ, Hassanein A, Morsy S (2017) An integrated approach for identification of potential aquifer zones in structurally controlled terrain: Wadi Qena basin, Egypt. CATENA 149:73–85
Keheila EA (1983) Sedimentology and stratigraphy of the carbonate rocks in the area northeast of Assiut. PhD thesis, submitted to Geology Department, Assiut University
Klitzsch E, List FK, Pohlmann G (1987) Geological map of Egypt 1:500.000, map sheet NG 35 Dakhla. The Egyptian General Petroleum Corporation, CONOCO, Berlin.
Levallois P, Thériault M, Rouffignat J, Tessier S, Landry R, Ayotte P, Girard M, Gingras S, Guavin D, Chiasson C (1998) Groundwater contamination by nitrates associated with intensive potato culture in Québec. Sci Total Environ 217:91–101. https://doi.org/10.1016/s0048-9697(98)00191-0
Mahmood Y, Hossein NS, Ali AM, Amir HM, Mansour G, Hamed S (2017) Data on water quality index for the groundwater in rural area Neyshabur County, Razavi Province, Iran. Data Brief 15:901–907. https://doi.org/10.1016/j.dib.2017.10.052
Mahmood Y, Hossein NS, Amir HM, Mahmood A, Ramin N, Ali AM (2018) Data on corrosion and scaling potential of drinking water resources using stability indices in Jolfa, East Azerbaijan, Iran. Data Brief 16:724–731. https://doi.org/10.1016/j.dib.2017.11.099
Mansour HH, Philobbos ER (1983) Lithostratigraphic classification of the surface Eocene carbonates of the Nile Valley, Egypt: a review. Bull Fac Sci Assiut Univ 12(2):129–151
Megahed HA, Farrag AEA (2019) Groundwater potentiality and evaluation in the Egyptian Nile Valley: case study from Assiut Governorate using hydrochemical, bacteriological approach, and GIS techniques. Bull Natl Res Centre 43:48. https://doi.org/10.1186/s42269-019-0091-0
Mohamed L, Sultan M, Ahmed M, Zak A, Sauck W, Soliman F, Yan E, Elkadiri R, Abouelmagd A (2015) Structural controls on groundwater flow in basement terrains: geophysical, remote sensing, and field investigations in Sinai. Surv Geophys 36(5):717–742
Mohammad SMT, Janardhana MR, Mohamed MA (2019) Hydrochemical processes and groundwater quality assessment in North eastern region of Jordan valley, Jordan. HydroResearch 2:129–145. https://doi.org/10.1016/j.hydres.2020.02.001
Mousa SE, Attia FA, El Fotouh A (1993) Geoelectric investigation for groundwater at Wadi El-Asyuti, Egypt. Ain Shams Sci Bull 31:425–439
Negm AM, Sakr S, Abd-Elaty I, Abd-Elhamid HF (2018) An overview of groundwater resources in Nile Delta Aquifer. In: Negm AM (ed) Groundwater in the Nile Delta. Springer, Cham, pp 3–44
Omara S, El-Tahlawi MR (1972) Limestone “dykes” in the Nile Valley around Assiut, Upper Egypt. N. Jb. Geol. Paleont. Mn, Stuttgart, pp 475–483
Omara S, El-Tahlawi MR, Hafez H (1970) The geology of the environs of Assiut. Bulletin of the Egyptian Geographical Society, Cairo, p 43
Omara S, Tahlawi MR, Abd El-Kireem H (1973) Detailed geological mapping of the area between the latetudes of Sohag and Girga, east of the Nile Valley. Bull. Fac. Eng., Assiut University, pp 149–166
Ongley ED (1999) Water quality: an emerging global crisis. In: Trudgill ST, Walling DE, Webb BW (eds) Water quality: processes and policy. Wiley, London, pp 29–31
Osman HZ (1980) Geological studies on the area to the Northwest of Assiut, MSc thesis, Assiut University
Parkhurst DL, Appelo CAJ (1999) User’s guide to PHREEQCA computer program for speciation, reaction-path, 1D transport, and inverse geochemical calculations. U.S. Geological Survey Water-Resources Investigations Report
Paul R, Brindha K, Gowrisankar G et al (2019) Identification of hydrogeochemical processes controlling groundwater quality in Tripura, Northeast India using evaluation indices, GIS, and multivariate statistical methods. Environ Earth Sci 78:470. https://doi.org/10.1007/s12665-019-8479-6
Picker H, Hawkins S, Pehrson E (1992) Irrigation practices, herbicides use, and groundwater contamination in citrus production: a case study in California. Agric Ecosyst Environ 14(1):1–17. https://doi.org/10.1016/0167-8809(92)90176-C
Piper AM (1944) A graphic procedures in geochemical interpretation of water analysis. Trans Am Geophys Union 25:914–928. https://doi.org/10.1029/TR025i006p00914
Pogotto C, RemyN LM, Cloriec P (2001) Heavy metal pollution of road dust and roadside soil near a major rural highway. Environ Technol 22:207–319. https://doi.org/10.1080/09593332208618280
Rainwater FH, Thatcher LL (1960) Methods for collection and analysis of water samples. US Geol. Surv., Water Supply, paper No. 1454, USA
Rangsivek R, Jekel R (2005) Removal of dissolved metals by zero-valent iron (ZVI): kinetics, equilibria, processes and implications for stormwater runoff treatment. Water Res 39:4153–4163. https://doi.org/10.1016/j.watres.2005.07.040
Richards A (1954) Diagnosis and improvement of saline and alkali soils. USDA Handb 78(2):85–88
Romic M, Romic D (2003) Heavy metal distribution in agricultural topsoil in urban area. Environ Geol 45(97):795–805. https://doi.org/10.1007/s00254-002-0694-9
Said R (1961) Tectonic framework of Egypt and its influence and distribution of foraminifera. Am Ass Petrol Geol Bull 45:198–218. https://doi.org/10.1306/0BDA6335-16BD-11D7-8645000102C1865D
Said R (1962) The geology of Egypt. Elsevier, Amsterdam
Said R (1981) The geological evolution of the River Nile. Springer, New York. https://doi.org/10.1007/978-1-4612-5841-4
Said R (1990) The Geology of Egypt. Elsevier, New York
Santos A, Alonso E, Callejon M, Jimenez C (2002) Distribution of Zn, Cd, Pb, and Cu metals in groundwater of the Guadiamar River Basin. Water Air Soil Pollut J 134(1–4):273–283. https://doi.org/10.1023/A:1014149107094
Satyajit KG, Ajaykumar KK, Ritish RR, Akanksha SK, Vasant MW, Vinash MK, Suryakant PG, Ramdas BM, Namdev JP, Kishor DK (2020) Assessment of the groundwater geochemistry from a part of west coast of India using statistical methods and water quality index. HydroResearch 3:48–60. https://doi.org/10.1016/j.hydres.2020.04.001
Shama KM (1972) Geology of the area between Manfalut and Dairut. MSc thesis, Faculty of Science, Assiut University
Sulin VA (1948) Basis of classification of natural water. Moscow-Leningrad Academy of Science, USSR, pp 55–67
Sultan M, Yan E, Sturchio N, Wagdy A, Gelil KA, Becker R, Manocha N, Milewski A (2007) Natural discharge: a key to sustainable utilization of fossil groundwater. J Hydrol 335(1–2):25–36
Tanji K, Valoppi L (1989) Groundwater contamination by trace elements. Agric Ecosyst Environ 26(3–4):229–274. https://doi.org/10.1016/0167-8809(89)90015-7
U.S. Salinity Laboratory Staff (1954) Diagnoses and improvement of saline and alkali soils. U.S. Dept. Agr., handbook No. 60, Washington, DC. https://doi.org/10.1126/science.120.3124.800
WHO (World Health Organisation) (2004) Guidelines for drinking water quality, vol 1, 2nd edn. Recommendations, WHO, Geneva, p 130
Wilcox LV (1955) Classification and use of irrigation waters. USDA, Washington, DC Circular, p 969
Yousef AF (2008) The impact of North West active fault system on the recharge of the quaternary aquifer system around the Nile valley: case study Wadi El-Assiuti, Eastern Desert, Egypt. Eur Water 21(22):41–55
Youssef MM, Mansour HH, Philobbos ER, Osman ZL (1982) Contribution to the geology of the area northwest of Assiut, Egypt. Bull Fac Sci Assiut Univ 11:335–354
Youssif M, Hussien HM, Abotalib AZ (2020) The respective roles of modern and paleo recharge to alluvium aquifers in continental rift basins: a case study from El Qaa plain, Sinai, Egypt. Sci Total Environ 739:139927
Yuan F, Sawaya KE, Loeffelholz BC, Bauer ME (2005) Land cover classification and change analysis of the Twin Cities (Minnesota) Metropolitan Area by multitemporal Landsat remote sensing. Remote Sens Environ 98:317–332. https://doi.org/10.1016/j.rse.2005.08.006
Zwolak A, Sarzyńska M, Szpyrka E et al (2019) Sources of soil pollution by heavy metals and their accumulation in vegetables: a review. Water Air Soil Pollut 230:164. https://doi.org/10.1007/s11270-019-4221-y
Acknowledgements
Not applicable.
Funding
Not applicable.
Author information
Authors and Affiliations
Contributions
HAM contributed her idea, studied the geology and climate of the study area, collected the groundwater samples, performed the chemical analyses of these samples and representation of the hydrochemical data were used by the Geographic Information System (Arc GIS Ver 10.1) software to determine the suitability of groundwater for drinking and irrigation uses. Finally, reviewed and writing the final manuscript. The author read and approved the final manuscript.
Corresponding author
Ethics declarations
Ethics approval and consent to participate
Not applicable.
Consent for publication
Not applicable.
Competing interests
The author read and approved the final manuscript.
Additional information
Publisher's Note
Springer Nature remains neutral with regard to jurisdictional claims in published maps and institutional affiliations.
Rights and permissions
Open Access This article is licensed under a Creative Commons Attribution 4.0 International License, which permits use, sharing, adaptation, distribution and reproduction in any medium or format, as long as you give appropriate credit to the original author(s) and the source, provide a link to the Creative Commons licence, and indicate if changes were made. The images or other third party material in this article are included in the article's Creative Commons licence, unless indicated otherwise in a credit line to the material. If material is not included in the article's Creative Commons licence and your intended use is not permitted by statutory regulation or exceeds the permitted use, you will need to obtain permission directly from the copyright holder. To view a copy of this licence, visit http://creativecommons.org/licenses/by/4.0/.
About this article
Cite this article
Megahed, H.A. GIS-based assessment of groundwater quality and suitability for drinking and irrigation purposes in the outlet and central parts of Wadi El-Assiuti, Assiut Governorate, Egypt. Bull Natl Res Cent 44, 187 (2020). https://doi.org/10.1186/s42269-020-00428-3
Received:
Accepted:
Published:
DOI: https://doi.org/10.1186/s42269-020-00428-3
