- Research
- Open access
- Published:
Extraction of high-quality genomic DNA from different plant orders applying a modified CTAB-based method
Bulletin of the National Research Centre volume 43, Article number: 25 (2019)
Abstract
Background
Reliable measurement of DNA concentration and purity is important for almost all molecular genetics studies. Different plant species have varying levels of polysaccharides, polyphenols, and other secondary metabolites which combine with nucleic acids during DNA isolation and further affect the quality of the extracted DNA. The current extraction protocol is based upon the conventional cetyl trimethylammonium bromide (CTAB) method with further modifications for the extraction of DNA from variable plant seeds and crops belonging to seven different orders. The principle modifications currently employed for DNA extraction involved the use of higher CTAB concentration and higher levels of 2-β-mercaptoethanol. Additionally, higher concentrations of sodium chloride and potassium acetate were added simultaneously with absolute ice cold isopropanol for the precipitation of DNA free from polysaccharides.
Results and conclusion
The prescribed modifications in the present method establish a quick and efficient standardized protocol for DNA extraction from different plant orders. The current extraction protocol, therefore, can be of great value for molecular analysis involving large numbers of different plant samples from different orders. These modifications consistently produced pure and high-quality DNA suitable for further molecular analysis. Successful PCR amplification with random amplified polymorphic DNA primer, NPTII gene, and the complete digestion of the isolated DNA with the HindIII restriction enzyme validated the quality of the isolated DNA. Moreover, it reflects the efficiency of the protocol and proves its suitability for further applications for the assessment of food safety, detection of genetically modified (GM) crops, and conservation of biodiversity.
Background
Isolation and purification of DNA are a crucial step in DNA molecular techniques used in plant studies for the identification of genotypes, economical traits associated with genes of interest, and genetic diversity. Reliable measurement of DNA concentration and purity is also important for the assessment of food safety, especially with the increase of the global cultivation area of genetically modified (GM) crops (Ateş Sönmezoğlu and Keskin 2015). To facilitate protection of biodiversity and to guarantee rational use of these GM crops, sufficient measurements for purity, quality, and amount of DNA present in these products must be determined to comply with labeling regulation requirements.
DNA molecular techniques are mainly based on polymerase chain reaction (PCR) assay that requires isolation of genomic DNA of suitable purity. Various extraction protocols have been established in order to isolate pure and intact whole genomic DNA from plant tissues (Saghai-Maroof et al. 1984; Doyle and Doyle 1990; Scott and Playford 1996; Sharma et al. 2000; Pirttilä et al. 2001; Shepherd et al. 2002; Mogg and Bond 2003; Haymes 1996).
However, many difficulties have been reported for isolating good-quality DNA from plants (Novaes et al. 2009; Silva 2010; Moreira and Oliveira 2011). These difficulties were attributed to the fact that different plant species have varying levels of polysaccharides, polyphenols, and other secondary metabolites. These components are usually hindering the process of DNA purification and its further use in molecular studies (Khanuja et al. 1999). These plant components have a similar structure of nucleic acids that allow secondary metabolites and polysaccharides to interfere with total DNA isolation (Shioda and Marakami-Muofushi 1987). They strongly combine with nucleic acids during DNA isolation and affect the quality of the extracted DNA from higher plants (Scott and Playford 1996). These metabolites also affect the quantity and purity of the isolated nucleic acids (Porebski et al. 1997). The removal of such contaminants needs complicated and time-consuming protocols. A single DNA isolation protocol is not likely to be applicable for all the plant tissues (Loomis 1974). Most of the cetyl trimethylammonium bromide (CTAB)-based protocols used for the extraction of DNA were tailored according to the internal components of each single plant species (Wang et al. 2012; Moreira and Oliveira 2011).
The present work describes an inexpensive CTAB-based method with modifications for the extraction of high-quality genomic DNA from 19 different plant seeds and crops belong to seven different plant orders. These plant samples are rich in proteins, polysaccharides, and polyphenols. In comparison, we used the classical protocol of Doyle and Doyle (1990) for isolation of DNA from the same samples. In order to validate the quality of the DNA extracted by the modified protocol, PCR amplification of genomic DNA extracted from different plant seeds applying the two utilized protocols was carried out using random amplified polymorphic DNA (RAPD). PCR amplification of neomycin phosphotransferase gene (nptII) was used to evaluate the efficacy of the present protocol to produce good-quality DNA suitable for detection of genetically modified crops.
Materials and methods
Plant materials
Twenty-seven plant samples were purchased locally from plant seed suppliers in Egypt (Table 1). They were chosen to be enrolled in this study because they have varying amounts of polysaccharides, proteins, and polyphenols and they belong to seven different orders. These plant samples were mainly imported from different countries distributed in Europe, America, and Asia. Additionally, four animal diet samples (D1, D2, D3, and D4) were also purchased from different suppliers. These four diet samples contain mixtures of soybean and corn.
Reagents
-
3× extraction buffer containing: 3% CTAB (w/v), 1.4 M NaCl, 0.8 M Tris-HCl pH 8.0, 0.5 M EDTA pH 8.0 (autoclaved)
-
0.3% 2-β-Mercaptoethanol.
-
Chloroform:isoamyl alcohol (24:1 v/v).
-
6 M NaCl
-
3 M potassium acetate
-
Ice cold 100% isopropyl alcohol
-
70% ethanol
-
1× TE buffer (10 mM Tris-HCl, pH 8.0; 1 mM EDTA, pH 8.0, autoclaved).
-
Agarose (molecular grade)
Modified DNA extraction protocol
-
i.
Preheat the 3× extraction buffer in water bath at 65 °C. Add 0.3% 2-β-mercaptoethanol to the 3× CTAB extraction buffer immediately before use.
-
ii.
Grind 50 mg of plant samples into powder in liquid nitrogen using pre chilled mortar and pestle. While still in the mortar, add 800 μl of the preheated 3× CTAB extraction buffer to the grinded plant samples and swirl gently to mix using the pestle.
-
iii.
Transfer the sample mixture to a 2-ml microcentrifuge tube, incubate in water bath at 60–65 °C for 1 h, mix gently every 20 min by inverting the tube for 20 times each, then cool down to the room temperature.
-
iv.
Add an equal volume of chloroform:isoamyl alcohol (24:1 v/v) and mix by slight inversion.
-
v.
Centrifuge at 13,000 rpm for 15 min at room temperature (RT).
-
vi.
Using a wide bore pipet, carefully transfer the upper aqueous phase, which contains the DNA, to a new 1.5-ml eppendorf tube.
Repeat the extraction steps (iv–vi), when necessary until the upper aqueous phase is clear.
-
vii.
Estimate the volume of the aqueous phase (approximately 700 μl) then add half this volume (350 μl) of 6 M NaCl and mix well. Successively, add 1/10 the volume (70 μl) 3 M potassium acetate and simultaneously mix with 500 μl ice cold 100% isopropyl alcohol (approximately two thirds the volume of the aqueous phase). Invert gently to precipitate DNA until the formation of DNA threads.
-
viii.
Incubate at − 20 °C for 30 min.
-
ix.
Centrifuge at 13,000 rpm for 5 min, discard supernatant.
-
x.
Invert the tube containing the DNA pellet on tissue paper to complete draining off the supernatant.
-
xi.
Wash DNA pellet with 500 μl of 70% ethanol and invert once (to dissolve residual salts and to increase purity of the DNA).
-
xii.
Centrifuge at 13,000 rpm for 5 min.
-
xiii.
Discard 70% alcohol from tubes. invert the on filter paper, and allow tubes containing pellet to air dry at room temperature for 15 min.
-
xiv.
Re-suspend the DNA pellet in 50 μl 1× TE buffer. Incubate the DNA at 50 °C for 1 to 2 h to ensure complete re-suspension.
-
xv.
Store at − 20 °C till further use.
Quantitative and qualitative analysis of DNA extracted by established CTAB method and modified protocol
DNA concentration, purity, and quality
DNA concentration was determined spectrophotometrically at 260 nm (A260) absorption using NanoDrop1000 (Thermo Scientific). Purity of DNA from protein and polysaccharide contamination (Wilson and Walker 2005) was assessed by estimating the absorbance ratio at A260/A280 and A260/A230 respectively. The quality of the extracted DNA using both protocols was also evaluated by electrophoresis separation for all DNA samples on 0.8% agarose gel stained with ethidium bromide (1 μg/ml).
DNA digestion analysis
HindIII restriction enzyme was used to digest the DNA samples according to the procedure of Fang and colleagues (1992). Approximately 20 μg of genomic DNA was digested separately for 1 h at 37 °C with HindIII restriction enzyme (Amersham Pharmacia Biotech. UK Ltd). All stained electrophoresis separation matrices for PCR amplification and both extracted and digested DNA samples were resolved by SYNGENE Bio Imaging Gel Documentation System (UK).
Random amplified polymorphic DNA analysis
PCR amplification of genomic DNA extracted from different plant seeds applying the two protocols utilized was carried out using random amplified polymorphic DNA (RAPD) decamer primer (OPZ-09) that was synthesized by Operon Primer Kits (Operon, USA). The primer sequence is 5′-CAGCACTGAC-3′. PCR was performed for all samples according to the method described by Devi and colleagues (2013).
Detection of genetically modified (GM) crops
The efficacy of the present protocol to produce good-quality DNA suitable for detection of genetically modified crops was also assessed. The isolated genomic DNA from different plant samples by means of the present protocol and the conventional method was used as a template for PCR amplification of neomycin phosphotransferase gene (nptII), which is utilized as a selectable marker gene in the transformation processes. The existence of NPTII (173 bp target) was investigated in the plant seeds enrolled in the present work, using specific primers for this gene (F: 5′-GGATCTCCTGTCATCT-3′ and R: 5′-GGATCTCCTGTCATCT-3′). The PCR amplification was carried out in a 25-μl reaction mixture containing 12.75 μl of DNase free water, 100 ng template DNA (2 μl), 200 μM of each dNTP (2.5 μl), 2.5 pmol of each primer (2.5 μl), and 2.5 units of taq DNA polymerase (0.25 μl) in a reaction buffer (2.5 μl) containing 75 mM Tris-HCl, pH 8.0, 2 mM MgCl2, 50 mM KCl, 20 mM (NH4)2SO4, and 0.001% BSA.
PCR amplifications were performed in a TM Thermal cycler (MJ Research PTC-100 thermocycler) programmed to perform an initial denaturation step of 98 °C for 2 min, followed by 40 cycles consisting of 30 s at 95 °C for denaturation, 45 s at annealing temperature (50 °C), and 30 s at 72 °C for extension. A final extension step of 7 min at 72 °C was performed. Following completion of the cycling reaction, 2 μl of a loading dye (bromophenol blue) was added to 10 μl of each reaction product and separated by 2% agarose gel electrophoresis stained with 1 μg/ml ethidium bromide. PCR products were analyzed, using SYNGENE Bio Imaging Gel Documentation System, for the presence of a fluorescent band of the expected base pair (bp) size (173 bp).
Results
Applying the present standardized method, the extracted DNA concentrations varied with the different plant species used in the present work (Table 2). The yield of isolated DNA ranged from 2.238 ηg/mg of seeds in case of Cucurbitales maxima to 24.957 ηg/mg of seeds in the case of Lupinus lupinus. The other classical CTAB method employed (Doyle and Doyle 1990) also produced comparable range of DNA concentration (Table 2), yet with less purity in most cases. Most of DNA samples extracted by the original CTAB method had A260/A280 ratio below 1.8, while the A260/A280 ratios ranged from 2.08 to 2.23 in DNA samples extracted by our modified protocol.
The quality of the total DNA extracted by the present protocol, from different plant species, was also evaluated by electrophoresis separation. Results showed intense bands very close to the gel wells (Fig. 1, upper lane). Genomic DNA extracted by the CTAB method of Doyle and Doyle (1990) from the same samples did not produce distinct or intact bands (Fig. 1, lower lane). The NanoDrop spectrophotometer measurement profile showed a single absorbance peak at 260 nm in DNA samples extracted by our standardized protocol. Figure 2 shows an example of a NanoDrop measurement profile of extracted genomic DNA from Glycine max sample using our protocol. DNA samples extracted by the present modified extraction protocol were efficiently digested with the HindIII restriction enzyme (Fig. 3).
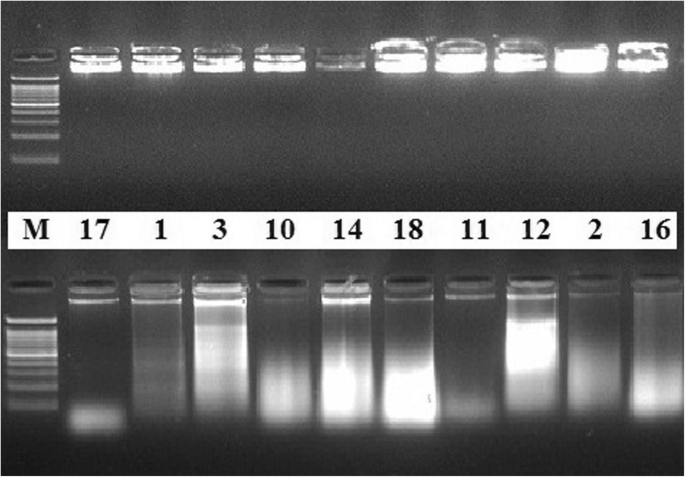
Quality of extracted DNA. Quality of DNA extracted from some of the plant samples using both DNA extraction methods. Electrophoresis separation was performed on 0.8% agarose gel matrix, stained with ethidium bromide. The upper lane is for samples extracted by the standardized method after modification; the lower lane is for the same samples extracted by the conventional method. M is a molecular marker (100 bp)

NanoDrop measurement profile. NanoDrop measurement profile of the extracted genomic DNA from the Glycine max sample using the modified protocol
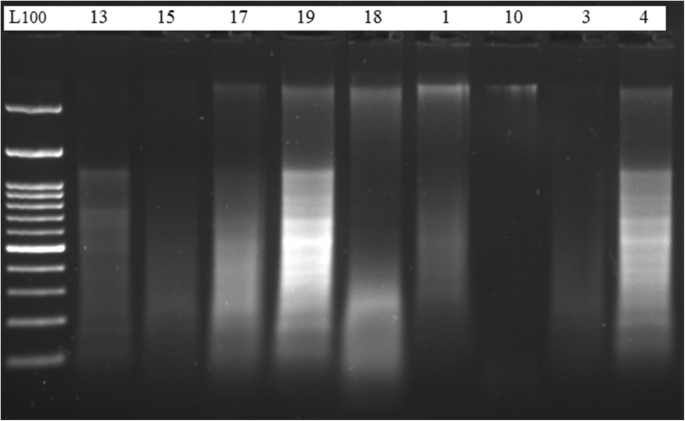
DNA digested with HindIII enzyme. DNA samples extracted by the standardized method and digested with HindIII enzyme. Digested products were separated in 1.5% agarose gel stained with ethidium bromide, in 1 × TAE buffer. The digested products were visualized by UV fluorescence. M is a molecular marker (50 bp)
PCR amplification with RAPD primer (OPZ-09) showed clear and well-differentiated band patterns (Fig. 4) in case of DNA samples extracted by the present DNA extraction protocol, whereas genomic DNA extracted by the other method from the same plant seed samples was rather difficult to be amplified (Fig. 4). Figure 5 shows the differences in the quality of the PCR amplification products of nptII (173 bp target) in plant samples which were extracted by both the conventional method and by the modified protocol.
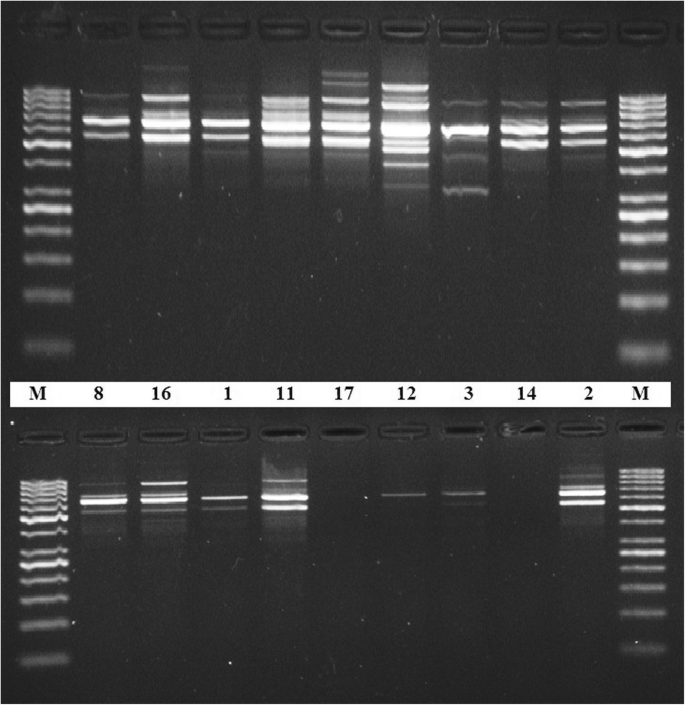
PCR amplification with RAPD primer (OPZ-09). PCR amplification of OPZ-09 primer and electrophoresis separation by 1.5% agarose gel of some DNA samples extracted by the standardized method (upper lane) and the classical method (lower lane). M is for molecular marker (50 bp)
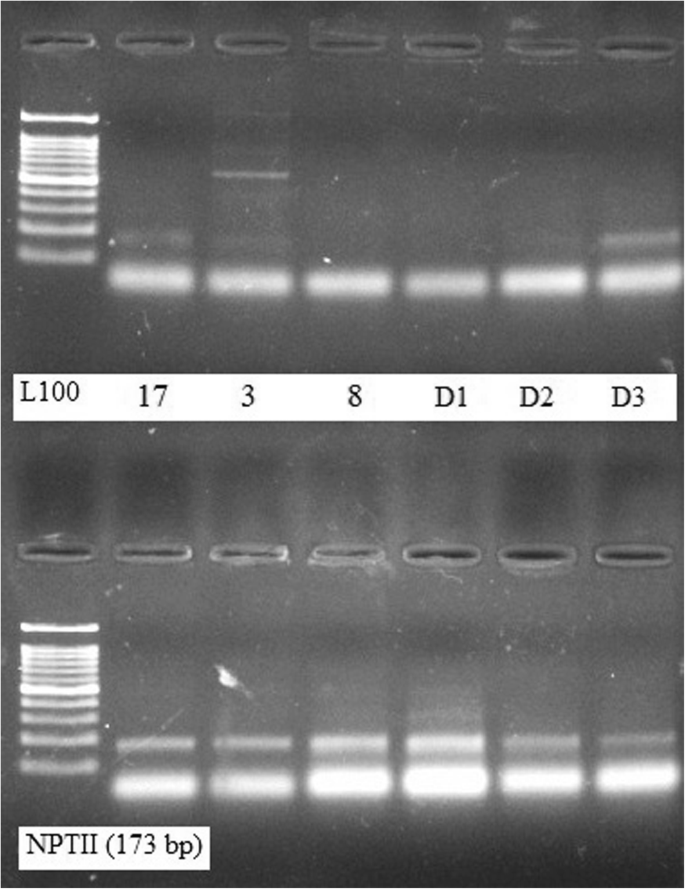
PCR amplification with nptII for detection of GM crops. Quality of the amplification of nptII (173 bp target) in the representative of DNA samples which were extracted by the conventional method (upper lane) and the standardized protocol (lower lane)
Discussion
The extraction of DNA from plant seeds is an essential step for satisfactory results in molecular studies particularly those involving plant genetics (Junior et al. 2016). Different seeds belonging to related genera or different orders contain many components with variable complexities that badly interfere with purity of the extracted DNA and molecular investigations following isolation procedures (Porebski et al. 1997; Ribeiro and Lovato 2007).
To insure isolation of DNA with better yield and quality from seeds of diverse plant orders, we implemented several steps in the present modified protocol. Liquid nitrogen was used to break the cell wall and disrupt the cell membrane (Clark 1997) while keeping cellular enzymes and other undesired chemicals deactivated, thus reducing shearing and damaging of the DNA. Other methods used for disrupting plant tissues, such as digestion with pectinase and cellulose (Manen et al. 2005), are not as reproducible or accurate as the use of liquid nitrogen.
High concentration of the 3× CTAB was also used to disrupt the cells and nuclear membranes in order to expose the genetic components (Amani et al. 2011). In the present modified method, the 3× CTAB buffer also contains the highest recommended concentration level (0.3%) of 2-β-mercaptoethanol which successfully removed polyphenols (Horne et al. 2004; Li et al. 2007) giving rise a clear translucent DNA pellet. The CTAB extraction buffer also includes 1.4 M of NaCl which improved the quality of the extracted DNA (Sahu et al. 2012).
To remove the remaining polysaccharides during DNA extraction from all plant samples included in the present work, a modification for the precipitation of DNA was also performed by increasing the concentration of sodium chloride and potassium acetate. The concentration of NaCl varied with plant species in a range between 0.7 M (Clark 1997) and 6 M (Aljanabi et al. 1999; Moreira and Oliveira 2011). In the present standardized protocol, we used 6 M NaCl (Moreira and Oliveira 2011) and 3 M potassium acetate (Paterson et al. 1993). These modifications successfully removed polysaccharides impurities from DNA extracted by this modified protocol from all plant samples and produced pure and high-quality DNA suitable for further molecular analysis. Proteins, most lipids, and cellular debris were removed by binding with non-aqueous compounds and precipitated during the chloroform-isoamyl alcohol step.
Longer incubation of the extracted DNA at − 20 °C also enhanced precipitation of DNA. In general, the quantity and quality of isolated DNA depend on precipitation temperature and duration (Michiels et al. 2003). Low-temperature precipitation employed in the present modified protocol increased DNA yield. Extracted DNA were re-suspended in minimum amount of 1× TE buffer since the presence of chelating agents in TE buffer can affect the PCR and other molecular analysis of the extracted DNA.
The method employed in the present work proved to be successful and applicable for extraction of DNA with high yield and purity from 19 different plant species that belong to seven different plant orders. The matrix variation effects on the purity and quality of the isolated genomic DNA were minimized by using the same plant samples as starting materials for both protocols employed in the present investigation.
Electrophoresis separation of DNA extracted by the present protocol showed intense bands very close to the gel wells (Fig. 1, upper lane) signifying high degree of purity and intact DNA. It is known that the presence of smear could be a sign of degradation of the extracted DNA which easily affects the quality of the subsequent molecular application results (Devi et al. 2013).
DNA samples extracted by the present protocol were assessed for successful PCR amplification with RAPD primer (OPZ-09). The presence of clear and well-differentiated band patterns (Fig. 4) reflects the efficiency of the protocol to produce genomic DNA with high purity suitable for molecular studies that based on PCR techniques (Devi et al. 2013).
Purification of DNA is also an important step for analyzing and measuring genetically modified (GM) food products (Ateş Sönmezoğlu and Keskin 2015). The DNA extracted by our standardized protocol yielded detectable and reproducible bands for NPTII (173 bp target) proving its suitability for PCR amplification as well as for the identification of GM crops using the PCR assay.
The A260/A280 purity ratio is an important measure for estimating the polyphenol contamination levels of the extracted DNA. Ratios of A260/A280 below 1.8 render the extracted DNA inappropriate for molecular investigations (Sambrook and Russell 2001). Therefore, higher level of 2-β-mercaptoethanol (0.3%) used in the present standardized method successfully removed polyphenols giving rise to translucent final DNA pellets (Suman et al. 1999).
In the present modified CTAB-based protocol, although the RNase A enzyme was not used during isolation and purification of DNA, the ratios of absorption A260/A280 of the extracted DNA (Table 2) were higher than the recommended optimal limit of DNA purity (Sambrook and Russell 2001). Similar results were also observed by Sambrook and Russell (2001) which were taken to be associated with RNA contamination. In our case, the resulted intact DNA bands, very close to the wells (Fig. 1, upper lane), indicated high purity of the extracted DNA with no RNA contamination, particularly that the recommended and the most accurate way to determine RNA contamination is to run the sample on an agarose gel where another band of the RNA, if present, will be visible in the gel (Wang et al. 2012). Therefore, the higher ratios of absorption A260/A280 in our case may be attributed to slight changes in the pH of the extracted samples (Wilfinger et al. 1997).
Polysaccharide contamination was also assessed (Table 2) by estimating the absorbance ratio A260/A230 as a secondary measure of nucleic acid purity (Wilson and Walker 2005). This ratio is important to evaluate the level of salt residues in the purified DNA. It is recommended to be greater than 1.5 and preferably close to 1.8. The reported values of A260/A230 ratio in most of the DNA plant samples extracted by the present modified protocol are higher than those of the DNA samples extracted by the other classical method.
Conclusion
The principle modifications currently employed for DNA extraction involved the use of higher CTAB concentration and higher levels of 2-β-mercaptoethanol. Additionally, higher concentrations of sodium chloride and potassium acetate were added simultaneously with absolute ice cold isopropanol for the precipitation of DNA free from polysaccharides.
The prescribed modifications in the present method establish a quick and efficient standardized protocol for DNA extraction from different plant orders. These modifications consistently produced pure and high-quality DNA suitable for further molecular analysis. The DNA standardized extraction protocol presented here is important for the assessment of food safety, detection of genetically modified crops, and biodiversity conservation. Therefore, it is of great value for molecular analysis involving large number of different plant samples.
Abbreviations
- bp:
-
Base pair
- CTAB:
-
Cetyl trimethylammonium bromide
- DNA:
-
Deoxyribonucleic acid
- GMO:
-
Genetically modified organisms
- HCl:
-
Hydrochloric acid
- NaCl:
-
Sodium chloride
- NPTII:
-
Neomycinphosphotransferase II gene
- OD:
-
Optical density
- RAPD:
-
Random amplified polymorphic DNA
References
Aljanabi MS, Forget L, Dookun A (1999) An improved and rapid protocol for the isolation of polysaccharide and polyphenol free sugarcane DNA. Plant Mol Biol Rep 17:1–8
Amani J, Kazemi R, Abbasi AR, Salmanian AH (2011) A simple and rapid leaf genomic DNA extraction method for polymerase chain reaction analysis. Iran J Biotech 9:69
Ateş Sönmezoğlu Ö, Keskin H (2015) Determination of genetically modified corn and soy in processed food products. J App Biol Biotech 3:032
Clark MS (ed) (1997) Plant molecular biology- a laboratory manual. Springer, New York, pp 305–328
Devi KD, Punyarani K, Singh S, Devi HS (2013) An efficient protocol for total DNA extraction from the members of order Zingiberales - suitable for diverse PCR based downstream applications. Springer Plus 2:669. https://doi.org/10.1186/2193-180-2-669
Doyle JJ, Doyle JL (1990) Isolation of plant DNA from fresh tissue. Focus 12:13
Fang G, Hammar S, Grumet R (1992) A quick and inexpensive method for removing polysaccharides from plant genomic DNA. BioTechniques 13:52–56
Haymes KM (1996) Mini-prep method suitable for a plant breeding program. Plant Mol Biol Rep 14:280
Horne EC, Kumpatla SP, Patterson MG, Thompson SA (2004) Improved high-throughput sunflower and cotton genomic DNA extraction and PCR fidelity. Plant Mol Biol Rep. 22:83
Júnior CDS, Teles NMM, Luiz DP, Isabel TF (2016) DNA Extraction from Seeds. In: Micic M, editor. Sample Preparation Techniques for Soil, Plant, and Animal Samples. Springer Protocols Handbooks. Humana Press, New York, pp.265-276. https://doi.org/10.1007/978-1-4939-3185-9_18
Khanuja SPS, Shasany AK, Darokar MP, Kumar S (1999) Rapid isolation of DNA from dry and fresh samples of plants producing large amounts of secondary metabolites and essential oils. Plant Mol Biol Rep. 17:1
Li JT, Yang J, Chen DC, Zhang XL, Tang ZS (2007) An optimized mini-preparation method to obtain high-quality genomic DNA from mature leaves of sunflower. Genet Mol Res 6:1064
Loomis MD (1974) Overcoming problems of phenolics and quinones in the isolation of plant enzymes and organelles. Methods Enzymol 31:528
Manen JF, Sinitsyna O, Aeschbach L, Markov AV, Sinitsyn A (2005) A fully automatable enzymatic method for DNA extraction from plant tissues. BMC Plant Biol 5:23
Michiels A, Van den Ende W, Tucker M, Van Riet L (2003) Extraction of high-quality genomic DNA from latex-containing plants. Anal Biochem 315:85
Mogg RJ, Bond JM (2003) A cheap, reliable and rapid method of extracting high-quality DNA from plants. Mol Ecol Notes 3:666
Moreira PA, Oliveira DA (2011) Leaf age affects the quality of DNA extracted from Dimorphandra mollis (Fabaceae), atropical tree species from the Cerrado region of Brazil. Genet Mol Res 10:353
Novaes RML, Rodrigues JG, Lovato MB (2009) An efficient protocol for tissue sampling and DNA isolation from the stem bark of Leguminosae trees. Genet Mol Res 8:86–96
Paterson AH, Brubaker CL, Wendel JF (1993) A rapid method for extraction of cotton (Gossypium spp.) genomic DNA suitable for RFLP or PCR analysis. Plant Mol Biol Rep. 11:122
Pirttilä MA, Hirsikorpi M, Kämäräinen T, Jaakola L, Hohtola A (2001) DNA isolation methods for medicinal and aromatic plants. Plant Mol Biol Rep. 19:273
Porebski S, Bailey LG, Baum BR (1997) Modification of a CTAB DNA extraction protocol for plants containing high polysaccharide and polyphenol components. Plant Mol Biol Rep. 15:8–15
Ribeiro RA, Lovato MB (2007) Comparative analysis of different DNA extraction protocols in fresh and herbarium specimens of the genus Dalbergia. Genet Mol Res 6:173
Saghai-Maroof MA, Soliman KM, Jorgensen RA, Allard RW (1984) Ribosomal DNA sepacer-length polymorphism in barley: Mendelian inheritance, chromosalmal localtionk, and population dynamic. Proc Natl Acad Sci U S A 81:8014
Sahu SK, Thangaraj M, Kathiresan KDNA (2012) Extraction protocol for plants with high levels of secondary metabolites and polysaccharides without using liquid nitrogen and phenol. Mol Biol 12:1
Sambrook J, Russell DW (2001) Molecular Cloning. A Laboratory Manual, Cold Spring Harbor Laboratory Press, New York
Scott KD, Playford J (1996) DNA extraction technique for PCR in rain forest plant species. Bio Techniques 20:974
Sharma KK, Lavanya M, V A (2000) A method for isolation and purification of peanut genomic DNA suitable for analytical applications. Plant BioTechniques Rep 18:393a
Shepherd M, Cross M, Stokoe RL, Scott LJ (2002) High-throughput DNA extraction from forest trees. Plant Mol Biol Rep. 20:425
Shioda M, Marakami-Muofushi K (1987) Selective inhibition of DNA polymerase by a polysaccharide purified from slime of Physarum polycephalum. Biochem Biophys Res Commun 146:61–66
Silva MN (2010) Extraction of genomic DNA from leaf tissues of mature native species of the Cerrado. Rev. Árvore 34:973–978
Suman PSK, Ajit KS, Darokar MP, Sushil K (1999) Rapid isolation of DNA from dry and fresh samples of plants producing large amounts of secondary metabolites and essential oils. Plant Mol Biol Rep. 17:1
Wang X, Xiao H, Zhao X, Li C, Ren J, Wang F , Pang L. Isolation of high-quality DNA from a desert plant Reaumuria soongorica, genetic diversity in plants, Mahmut Caliskan (Ed.), ISBN: 978–953–51-0185-7, InTech; 2012. https://doi.org/10.5772/38367
Wilfinger WW, Mackey K, Chomczynski P (1997) Effect of pH and ionic strength on the spectrophotometric assessment of nucleic acid purity. BioTechniques 22:474–481
Wilson K, Walker J (2005) Principles and techniques of biochemistry and molecular biology. University Press, Cambridge
Acknowledgements
Not applicable
Funding
The authors declare that this work was funded by the National Research Centre in Egypt (the 11th Research Project Plan, 2016-2019, Project ID: 11040201).
Availability of data and materials
We declare that all data generated or analyzed during this study are included in this article.
Author information
Authors and Affiliations
Contributions
NA-M made substantial contributions to conception and design of the work, involved in conducting the practical section of the work, and also involved in drafting the manuscript. HO made substantial contributions to conception, planning of the work, analysis, and interpretation of results and also involved in drafting the manuscript and revising it critically for important intellectual content, as well as gave the final approval of the version to be published. Each author has participated sufficiently in the work to take public responsibility for appropriate portions of the content and agreed to be accountable for all aspects of the work in ensuring that questions related to the accuracy or integrity of any part of the work are appropriately investigated and resolved. Both authors read and approved the final manuscript.
Corresponding author
Ethics declarations
Ethics approval and consent to participate
Not applicable
Consent for publication
Not applicable
Competing interests
The authors declare that they have no competing interests.
Publisher’s Note
Springer Nature remains neutral with regard to jurisdictional claims in published maps and institutional affiliations.
Rights and permissions
Open Access This article is distributed under the terms of the Creative Commons Attribution 4.0 International License (http://creativecommons.org/licenses/by/4.0/), which permits unrestricted use, distribution, and reproduction in any medium, provided you give appropriate credit to the original author(s) and the source, provide a link to the Creative Commons license, and indicate if changes were made.
About this article

Cite this article
Aboul-Maaty, N.AF., Oraby, H.AS. Extraction of high-quality genomic DNA from different plant orders applying a modified CTAB-based method. Bull Natl Res Cent 43, 25 (2019). https://doi.org/10.1186/s42269-019-0066-1
Received:
Accepted:
Published:
DOI: https://doi.org/10.1186/s42269-019-0066-1